Sparklines
Visuelle Revolution der Wortgrafik
Sparklines integrieren die Zeit in Tabellen. Damit nehmen Aussagekraft und Informationsdichte enorm zu. Unsere Software DeltaMaster ist ein Pionierprodukt in Sachen Sparklines und bietet einige patentierte und enorm wichtige Details für den richtigen Umgang mit diesem neuen Diagrammformat.
Definition von Sparklines
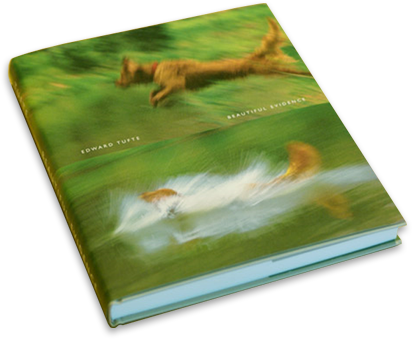
Sparklines sind miniaturisierte Zeitreihen in Wortgröße. Man nennt sie daher auch Wortgrafik oder Microchart, seltener Schwunglinie. Als Liniendiagramm wurden sie erstmals von Edward Tufte im Jahr 2004 vorgeschlagen. Beschriftet wird nur der letzte Datenpunkt. Das genügt, um den Verlauf davor zu verstehen. Tufte hat das Konzept mit vielen herausragenden Beispielen in seinem vierten Buch über Datenvisualisierung, Beautiful Evidence, beschrieben. Das Buch erschien 2006 und ist übrigens dasselbe Buch, in dem unser Bürohund Bella zur Visualisierungsexpertin geadelt wurde.
“A sparkline is a small intense, simple, word-sized graphic with typographic resolution. Sparklines mean that graphics are no longer cartoonish special occasions with captions and boxes, but rather sparkline graphics can be everywhere a word or number can be: embedded in a sentence, table, headline, map, spreadsheet, graphic. Data graphics should have the resolution of typography.”
Edward Tufte, Beautiful Evidence, Seite 46-63.
Eine elektrisierende Idee
Seit William Playfair (1759-1823) abstrakte volkswirtschaftliche Daten in den ersten Linien-, Säulen-, Balken-, Kreis- und Tortendiagrammen mit Mitteln der Geometrie veranschaulichte, hat es kein neues Format mehr mit ähnlicher Bedeutung fürs Business Intelligence gegeben.
Zumindest ist das unsere Ansicht. Wir waren elektrisiert und machten uns im Sommer 2004 ans Werk, entwickelten eigene Formate, schrieben für unsere Kunden einen Sparkline-Duden, entwickelten einen Sparkline-Font, integrierten Sparklines in unsere Software und einiges andere mehr.
Sparklines in DeltaMaster
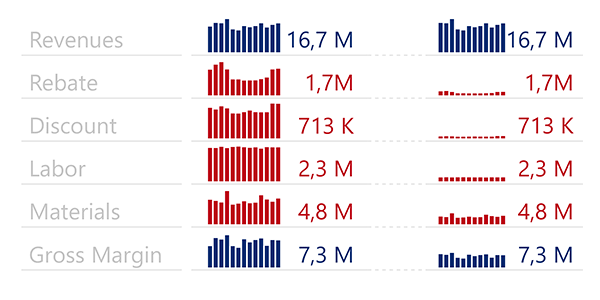
Mit der notorisch schwierigen Produktion und Interpretation von Diagrammen gehen in Business Intelligence, Performance Management und Controlling Kosten und Risiken einher. Seit Anfang der 2000er Jahre begegnen wir dem mit dem Konzept der Grafischen Tabellen. Sie verbinden die Ordnung von Tabellen mit der Attraktivität von Grafiken und vermeiden ihre Nachteile. Grafische Tabellen lieferten uns in DeltaMaster die technischen Möglichkeiten, grafische Elemente jeder Art in Tabellen unterzubringen. Die Säulenpaarreihen, mit denen wir in unserem Comparator, einem Data-Mining-Modul, auffällige Muster zeigten, gaben bereits einen Vorgeschmack auf die spätere Implementierung unserer Säulen-Sparklines in DeltaMaster 5.0.8 im Oktober 2004. Linien-Sparklines schreckten uns zunächst durchaus ab: Sie verlangen hohen Aufwand für vergleichbare Skalierung, ansonsten laden sie zur Fehlinterpretation ein. Bis heute dominieren Säulen-Sparklines in unseren Anwendungen für Analyse, Planung und Reporting.
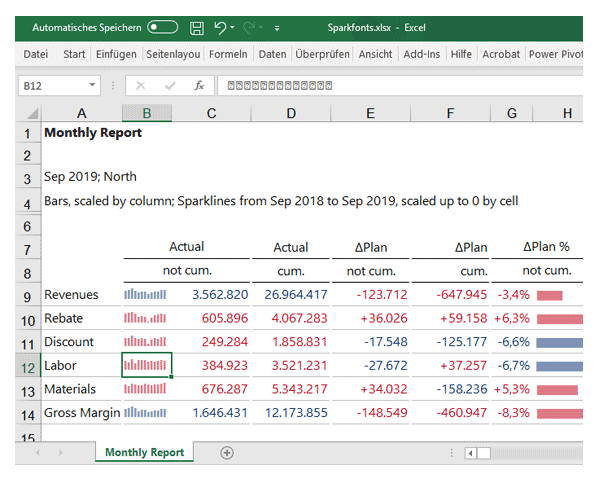
Sparkfonts
Als Edward Tufte auf seinem Blog den Vorabdruck seines Sparklines-Kapitels aus Beautiful Evidence publizierte, waren wir elektrisiert von der übergreifenden Bedeutung des Konzepts. Grafiken als Worte? Welch großartige Idee – auch außerhalb von Business Intelligence und Performance Management! Endlich würde man ganz allgemein die unselige Trennung von Zahl, Grafik und Wort überwinden, wie sie sich auf dem Computer immer noch in der Arbeitsteilung von Textverarbeitung, Tabellenkalkulation und Grafikprogrammen spiegelt, obwohl im Kopf doch alles zusammengehört. Wir sahen die Chance, Datendichte populär zu machen, und wollten zur Erkenntnis beitragen, dass es Tabellen oft am nötigen zeitlichen Kontext fehlt und Geschäftsdiagrammen an Übersichtlichkeit und Ordnung, um im Business Intelligence Wirkung zu entfalten. Wie aber Sparklines für wechselnde Daten erzeugen, wenn man kein Grafiker und Programmierer ist oder unseren DeltaMaster nicht hat? Wir bildeten Sparklines in einem TrueType-Font ab, stellten ihn Ende 2004 ins Netz und wer immer wollte, konnte mit Wortgrafiken buchstäblich schreiben – anfangs mithilfe einer Codierungstabelle. Wenig später erweiterten wir die Sparkfonts auf Tausende von Zeichen für unterschiedliche Säulen und Liniensegmente. Mit einer Art „Gelenklogik“ erzielten wir Verbesserungen bei der Darstellung der Linien. Daraus wurde eines unserer ersten Sparkline-Patente. Mehr zum frühen Schreiben mit Sparklines hier.
Sportlines auf Papier
Im Jahr 2010 nahmen wir gemeinsam mit einem Studienfreund eine für uns neue Perspektive ein. In seinem Berliner Magazin Traffic News-to-Go gingen wir experimentell der Frage nach, welche neue Informationsqualität sich die Druckmedien durch Sparklines erschließen könnten. Eine Zeitung kann Sparklines besonders gut produzieren: Papier lässt sich in hoher Auflösung bedrucken und ist dabei leicht zu lesen. Am Bildschirm hingegen geht schnell der Platz aus; was gleichzeitig zu sehen sein sollte, passt einfach nicht hin.
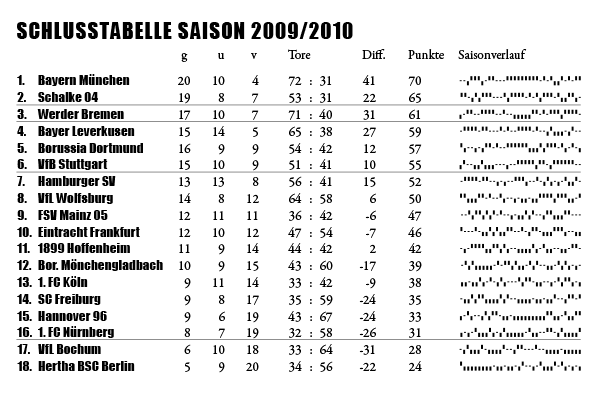
Wir begannen mit dem Sport: In der Juni-Ausgabe der Traffic News-to-Go druckten wir die Spielergebnisse aus vier Bundesliga-Saisons mit je einer Reihe von „Fähnchen“ je Verein und Saison ab. Die Fähnchen stehen für die Spielergebnisse. Ein Fähnchen oben: Spiel gewonnen, ein Fähnchen unten: verloren; ein Strich in der Mitte: unentschieden. Daraus entstehen Muster, die den Saisonverlauf für eine Mannschaft wiedergeben. Das benötigt überraschend wenig Platz; die üblichen Ergebnistabellen werden durch Sparklines kaum größer, die Datendichte aber steigt enorm. Wir brachten die 1.200 Spiele von vier Saisons unter. Das steht im Gegensatz zu den üblichen Momentaufnahmen aus der Tageszeitung. Sparklines erklären die Entwicklung mit allen Ereignissen, die zum Ergebnis geführt haben.
Datenworte auf Papier
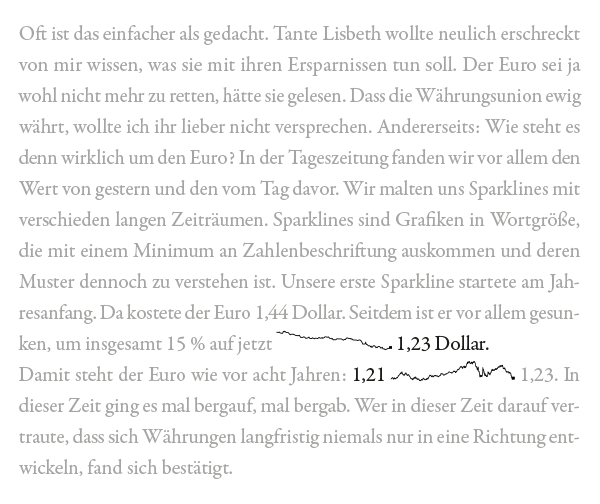
In der nächsten Ausgabe der Traffic News-to-Go setzten wir eins drauf: Sparklines machen sich nicht nur gut in Tabellen, wir können sie auch in den Text einbetten und Sätze daraus bilden. Im Text zu den Sportlines in der Ausgabe zuvor hatten wir schon Sätze mit dem Spielverlauf von Bayern München zum damaligen Meistertitel gebildet und das munter auch mit Spielverläufen anderer Vereine so gehalten. Auch sonst ließe sich mit Kontext die Qualität der Berichterstattung erhöhen und die allzu häufigen vermeintlichen „Krisenmeldungen“ verringern. Wie das geht, zeigten wir mit in den Text eingebetteten Verläufen zur Kursentwicklung des Euro, die alle gängigen kurzfristigen Wahrnehmungen und Behauptungen widerlegten.
Chartlines auf Papier
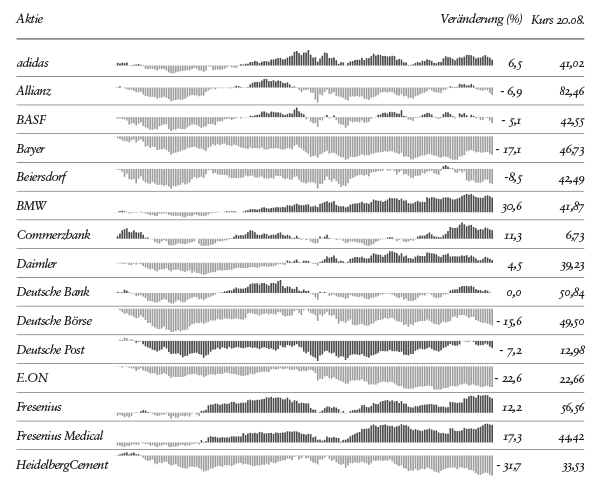
Den Abschluss unserer Sparkline-Trilogie in der Traffic News-to-Go bildete eine besonders datendichte Sparkline-Grafik. Wir zeigten die tagesaktuellen Kurse aller 30 Dax-Werte und schrieben per Sparkline die Entwicklung der Aktien seit Jahresbeginn dazu. Die Wirkung war enorm: Innerhalb der Augenspanne war auf einer fünftel Seite dieser Zeitung der Gegenwert von fast 5.000 Tageskursen zu besichtigen. Weil Sparklines wie Datenwörter funktionieren, können wir sie als Ganzes lesen, also wortweise, oder Buchstabe für Buchstabe, also zeichenweise. Und weil wir die Verläufe als Veränderung zum Kurswert vom Jahresbeginn zeigen, lassen sich alle Verläufe auch untereinander vergleichen, ebenfalls komplett oder Tag für Tag. Dieselbe Darstellung war auch auf den seinerzeitigen Versionen 3 und 4 des iPhone und auf dem iPad gut anzusehen. Die Smartphone-Bildschirme sind dem Papier dicht auf den Fersen.
Semantischer Zoom
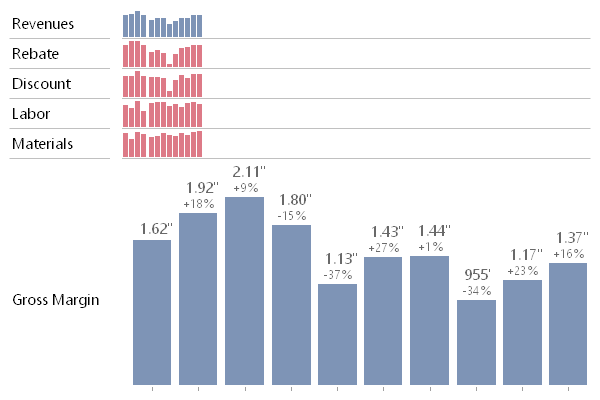
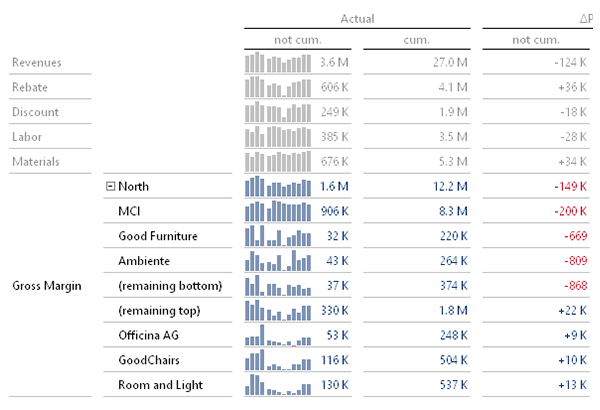
Für gewöhnlich funktionieren Sparklines ganz wunderbar in ihrer Reduktion. Nur der letzte, neueste, wichtigste Wert ist beschriftet. Das grafische Muster eines Auf und Ab, eines Anstiegs oder Abstiegs, der Fortsetzung oder Unterbrechung eines Trends erklärt diesen Wert. Im Managementalltag des Business Intelligence wendet man sich mitunter aber auch den früheren Werten zu, die in einer Sparkline nur grafisch repräsentiert, aber nicht numerisch ausgewiesen sind. Mit unserem semantischen Zoom schließen wir die Lücke zwischen der komprimierten, musterhaften Darstellung der Sparkline und einem ausgestalteten Zeitreihendiagramm. In vordefinierten Stufen wird der Sparkline mehr Bildschirmplatz zugestanden und dieser schrittweise für zusätzliche Datenbeschriftung genutzt. Die Vergrößerung ist so abgestimmt, dass vergrößerte und beschriftete Sparklines mit ihren unvergrößerten Nachbarn in ihren grafischen Mustern vergleichbar bleiben. Der semantische Zoom liefert stufenweise nicht nur die Istwerte, sondern auch die typischerweise interessierenden prozentualen Abweichungen von Periode zu Periode.
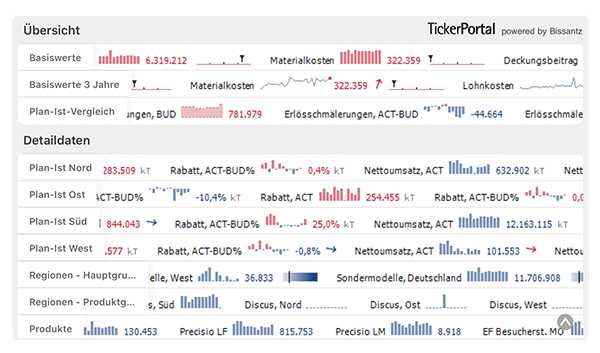
Sparkticker
Parallel zu der naturgemäß statischen Verwendung von Sparklines auf Papier interessierte uns die nur auf Bildschirmen mögliche dynamische Darstellung. Der semantische Zoom war eine Ausprägung – die Animation eine weitere. Bis heute sind animierte Formate selten in Business Intelligence, Performance Management und Controlling, obwohl bekanntermaßen wenig anderes so viel Aufmerksamkeit erregt wie Bewegung und Animation. Wir setzten also Sparklines in Bewegung und ließen sie über den Bildschirm ziehen, ähnlich, wie man das von News- oder Börsentickern im Fernsehen kennt, dort freilich ohne Sparklines. In einer erweiterten Version verbanden wir den semantischen Zoom mit dem Ticker, sodass Anwender bei auffälligen Mustern den Ticker anhalten und selektiv vergrößern können.
Drill Scroll
Der semantische Zoom liefert im Bedarfsfall Details zur Historie, die in der Sparkline komprimiert dargestellt ist. Der Zoom erweitert den Blick gewissermaßen in der Horizontalen. Ebenso ist ein „vertikaler Zoom“ wünschenswert: Man möchte wissen, wie sich ein Wert auf die Elemente von Handlungsdimensionen wie Produkten, Regionen oder Organisationseinheiten aufgliedert. Dementsprechend kombinierten wir den Sparkticker mit den aus DeltaMaster bekannten KI-basierten Navigationsalgorithmen und nannten das Ergebnis Drill Scroll. Durch Interaktion mit der Maus lassen sich die Handlungsdimensionen im selben Bild durchschalten oder verketten – ähnlich, wie wir es Jahre später, als Smartphones leistungsfähig genug geworden waren, in Form des Bissantz DashBoards vorgestellt haben.
Klanganimierte Sparklines
Das Verständnis von Mustern profitiert von mäßiger Redundanz: Wir verstehen dieselbe Information besser und schneller, wenn sie auf zwei Sinneskanälen übereinstimmend transportiert wird. Dieses Prinzip wandten wir auf Sparklines an, indem wir Säulen oder Liniensegmente in der zeitlichen Abfolge einblendeten und gleichzeitig proportional zu ihren Werten mit unterschiedlichen Tonhöhen klanganimierten. Eine Herausforderung stellte dabei die Wahl des passenden Musikinstruments dar, mit dem wir die Töne einspielten. Bei den meisten Instrumenten geht mit unterschiedlichen Tonhöhen auch eine schwerlich einzuordnende Emotionalität einher. In einem wenig bekannten afrikanischen Holzinstrument fanden wir schließlich einen passenden, wenig emotionalen Klangkörper, dessen Tonspektrum die Wahrnehmung von Wertunterschieden unterstützt, ohne einer Bewertung vorzugreifen.
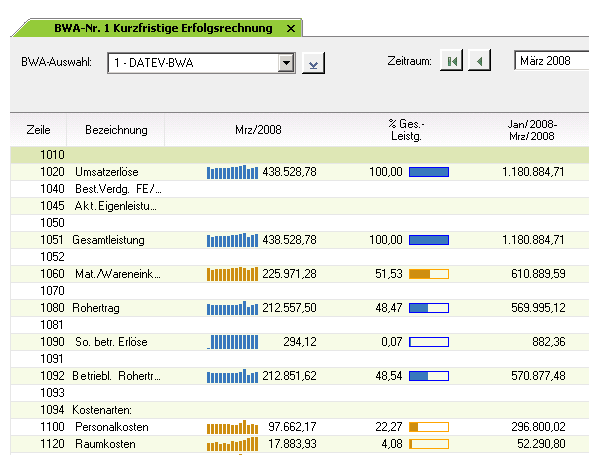
Sparklines in der Datev BWA
Die Datev ist das drittgrößte Softwarehaus in Deutschland, ihre Produkte sind der De-facto-Standard in der Steuerberatung und Wirtschaftsprüfung. Ihre Betriebswirtschaftliche Auswertung, kurz: BWA, ist eine der wichtigsten Informationsquellen für mittelständische Unternehmer. Die Zahlen in diesem Standardbericht gelten als zuverlässig und aktuell, die Monatsaufschreibung lässt jedoch keine Muster erkennen. Das änderte sich 2008, als die Datev Technologie aus unserem Haus in ihre BWA-Software integrierte – und damit Sparklines bei hunderttausenden Anwendern in den Kanzleien zum Durchbruch verhalf.